
In this project, a business solution was created in the form of a fictional library named ACAB. ACAB was created to solve a business information system
problem where the conventional library system which is the manual process of library operation existed.
It is an automated system that will make the operation seamless in which users can have access to books directly
from their homes or any location using their devices without having to physically visit the library.
The following models were developed in order to come up with a solution.
- A business model canvas.
- A mind map of solutions to the problems (developed with Xmind)
- The process map of how the system/mobile app will flow or communicate (A dataflow diagram developed with Microsoft visio)
- The prototype of the solution (developed with Pencil Project app)
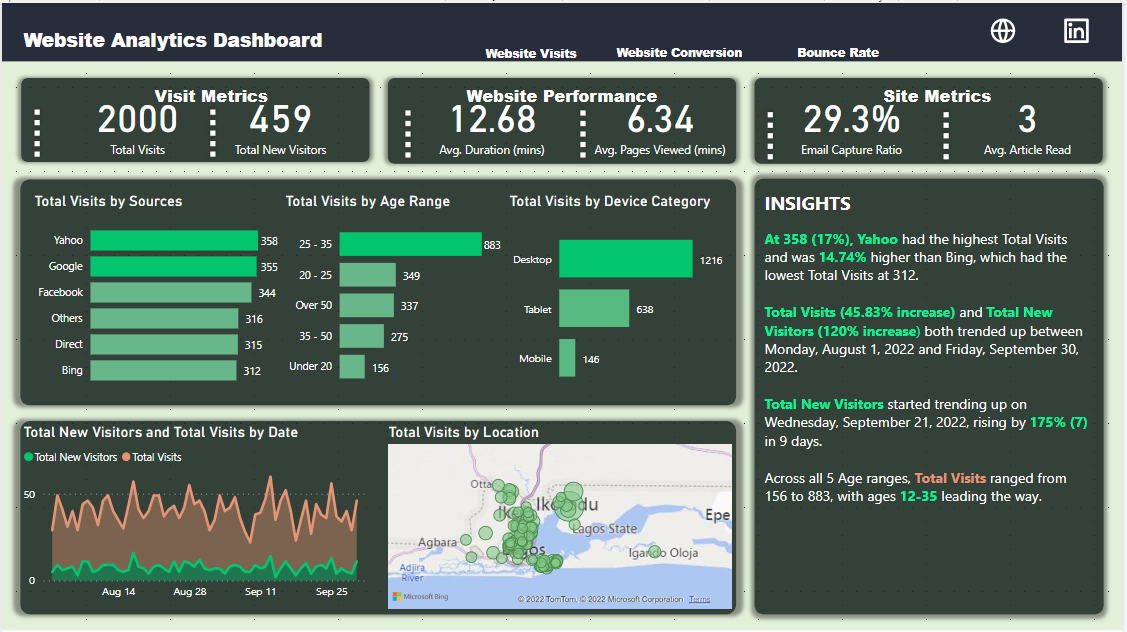
Web analytics is the process of analyzing the behavior of visitors to a website. This involves tracking, reviewing and reporting data to measure web activity, which
includes the use of a website and its components, such as webpages, images and videos. Using PowerBI and its DAX functions, I was able to identify the visit metrics,
site metrics, website performance, bounce rate and other significant customer behavioural metrics.
The analysis has three pages, with each one showing different metrics.

Using Microsoft SQL Server Management System (MSSMS), I implemented the concept of transactions
and rollback in a database.
I also performed some actions to demonstrate how Stored Procedures and Triggers work.
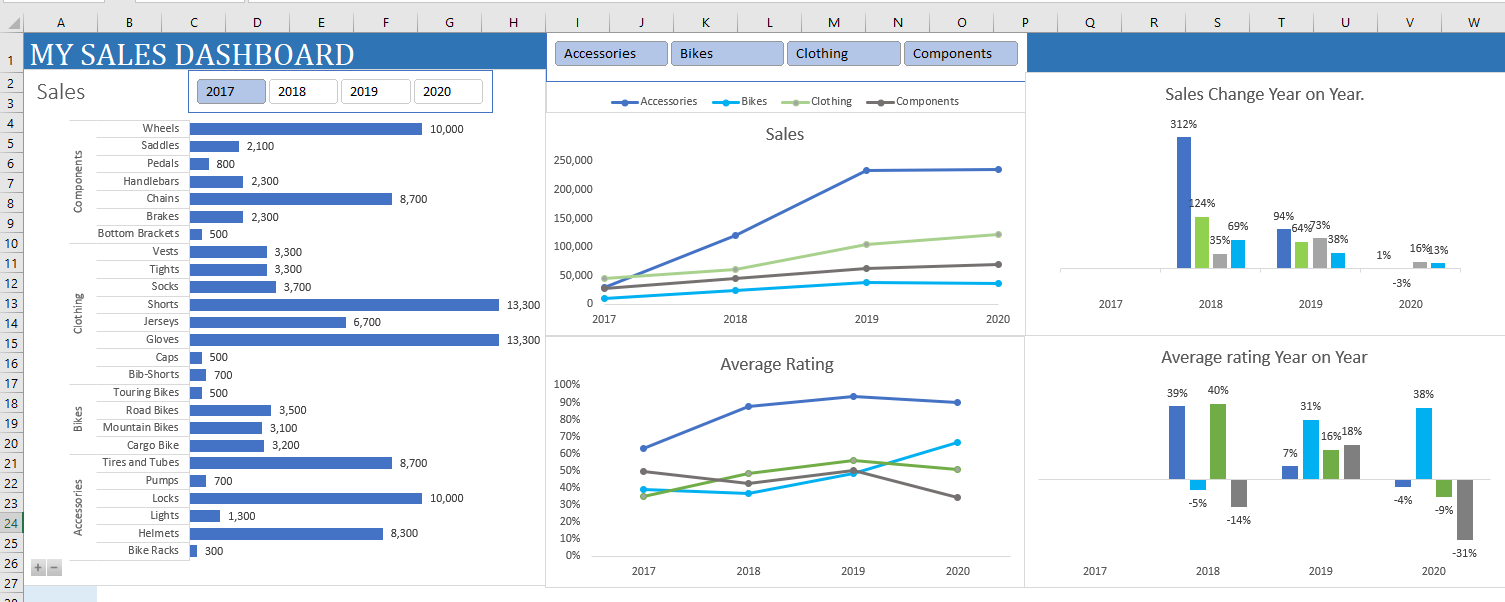
I utilized Excel's power query functionalities to carry out data cleaning. Then, I created pivot tables and appropriate
charts in order to explore and visualize the data and extract the trend of sales over a period of 4 years.

According to WHO, in 2019, the top 10 causes of death accounted for 55% of the 55.4 million deaths worldwide.
The top global causes of death, in order of total number of lives lost, are associated with three broad topics-
cardiovascular (ischaemic heart disease, stroke), respiratory (chronic obstructive pulmonary disease, lower
respiratory infections) and neonatal conditions.
Analyses and visualizations were performed on the data using
Python's Numpy, Pandas and matplotlib/seaborn libraries.

Propensity modelling in this project, attempts to predict the likelihood that visitors, leads and customers will
perform certain actions. It's a statistical approach that accounts for all the independent and
confounding variables that affect the said behaviour.
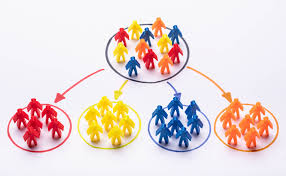
I completed a customer segmentation task to predict who will respond to an offer for a product or service using K-means and Agglomerative clustering.
A good response model can provide a significant boost to the efficiency of a marketing campaign by increasing responses or reducing expenses.
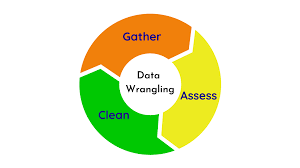
In this project, I utilized the power Excel and Python to rearrange, explore and analyse a qualitative dataset. I used Pandas library to
manipulate and format the data into a proper usable format that can be fully understood. The applied techniques reduced data processing
time and efforts by 50%. The source of data was a survey that was conducted with Survey Monkey and contains two header rows .

This analysis is about football players from the popular FIFA 22 video football game.
It is concentrated around
data cleaning and preprocessing while utilizing, pandas, numpy, seaborn and matplotlib libraies. The respective clubs of top players, their nationalities,
along with the corresponding skills and attributes that make them stand out were explored.

Customer churn prediction refers to detecting which customers are likely to leave a service or terminate
their subscription to a service. It is very critical for businesses because gaining new clients often costs
more than retaining the existing ones.
Investing in or acquiring new clients is a non-negotiable investment for any company.
When a client leaves, it represents a significant loss for the business.
A lot of resources need to be channelled into replacing them.
In this project, I trained the model and tried to predict the likelihood that a customer will churn.

Using MySQL workbench, I was able to perform queries in the database that contains a set of tables about some products,
and their transaction information. I carried out some exploration on the data and answered some questions in order about product sales.
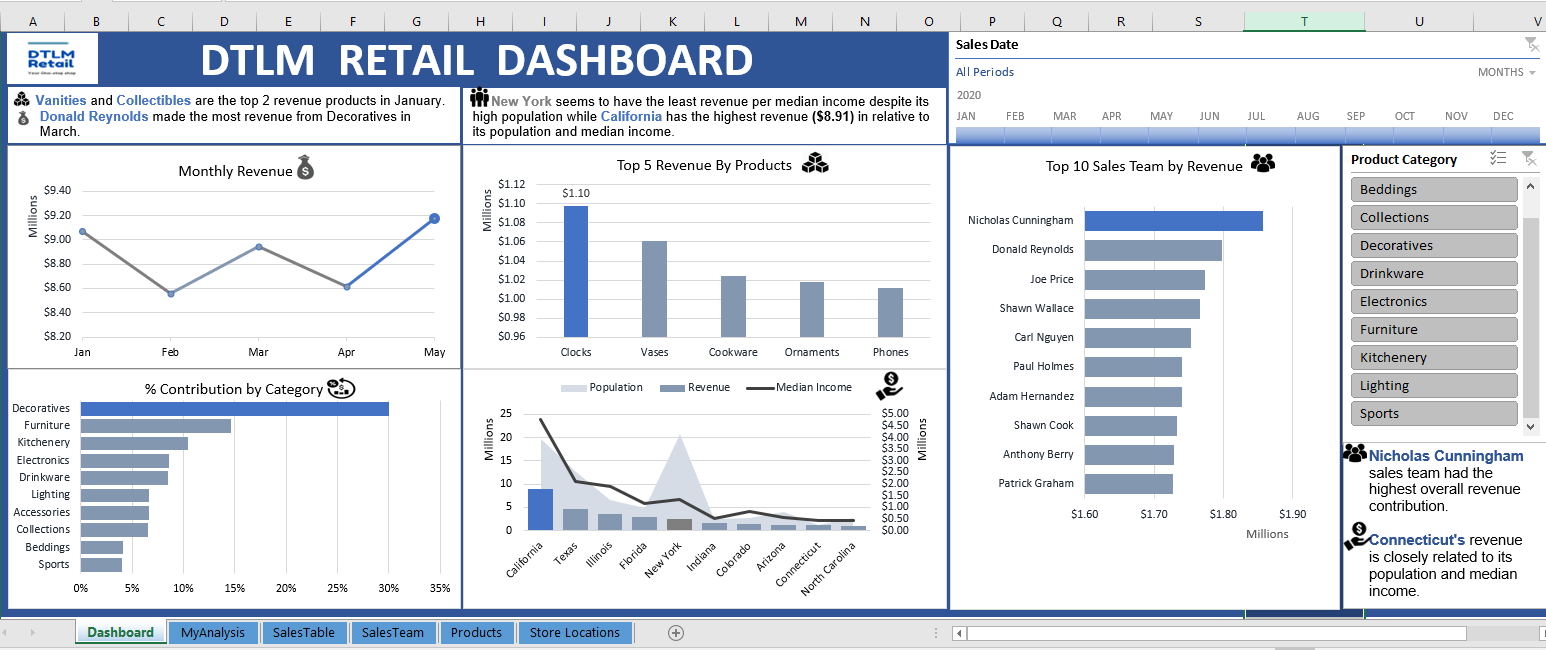
In this project, I carried out data modelling, exploration, analysis and visualization on a set of sales information for DTLM.
I answered some questions by creating several pivot tables, a slicer and an interactive dashboard.